 (+44) 7893 942215
 (+1) 918 238 5761
 (+61) 468 288 314
 (+91) 9831584855 (Sales only)






Businesses need to make decisions every day to survive or thrive. Data analytics opens up a new and innovative way for modern businesses to make decisions. With data analytics services, businesses can understand the facts and figures behind any decision and back up their next course of action with the appropriate data.
In this blog, we guide businesses about what data analytics is and how it benefits businesses. To avail of data analytics services, you can always reach out to the data analytics team at Techno Exponent.
What is Data Analytics?
Data analytics is the process of analyzing raw data to answer business questions and extract insights and trends from the data. Businesses use data analytics to answer important business questions and figure out what future decisions they need to make. Certain companies that do not have an in-house team usually outsource to data analysis consulting firms like Techno Exponent to build their datasets and create dashboards for them. Data analytics services help a company figure out its future course of action.
What are the benefits of data analytics?
- Data-driven decision-making
Organizations cannot take decisions based on whim, fantasy, hunches, or wild guesses. They depend on data to make their decisions. Data analytics is the process of uncovering insights, trends, patterns, and knowledge within a company using its data to effectively drive its decision-making.
- Reveals bottlenecks
Data analytics reveals the bottlenecks and hitches existing in an organization. Bottlenecks reveal where efficiency can be restored. Hence, data analytics opens up ways to restore efficiency in a company.
- Forecast for the future
Data analysis helps organizations forecast and plan ahead. It enables companies to take advantage of emerging trends and predict customer sales.
- Gain competitive advantage
With data analytics, a company is more aware of customer behaviour and market trends. Hence, they are in a better position to cater to customers, creating a competitive advantage for themselves.
- Driving innovation
Data analytics helps businesses innovate by turning data into valuable insights. It reveals customer preferences, identifies market gaps, and uncovers new growth opportunities. It also provides the high-quality data that powers AI and improves its performance.
Why is data analytics important to business?
The benefits of data analysis for business are manifold. Data analytics helps businesses understand their past performance, their processes, their services, and their customers. They can analyse what it is that their customers prefer, and innovate to provide those very solutions. Businesses can also understand what internal bottlenecks prevent them from doing better, and can then go on to enhance or optimize their operations to provide better products and solutions.
What are the different types of data analytics?
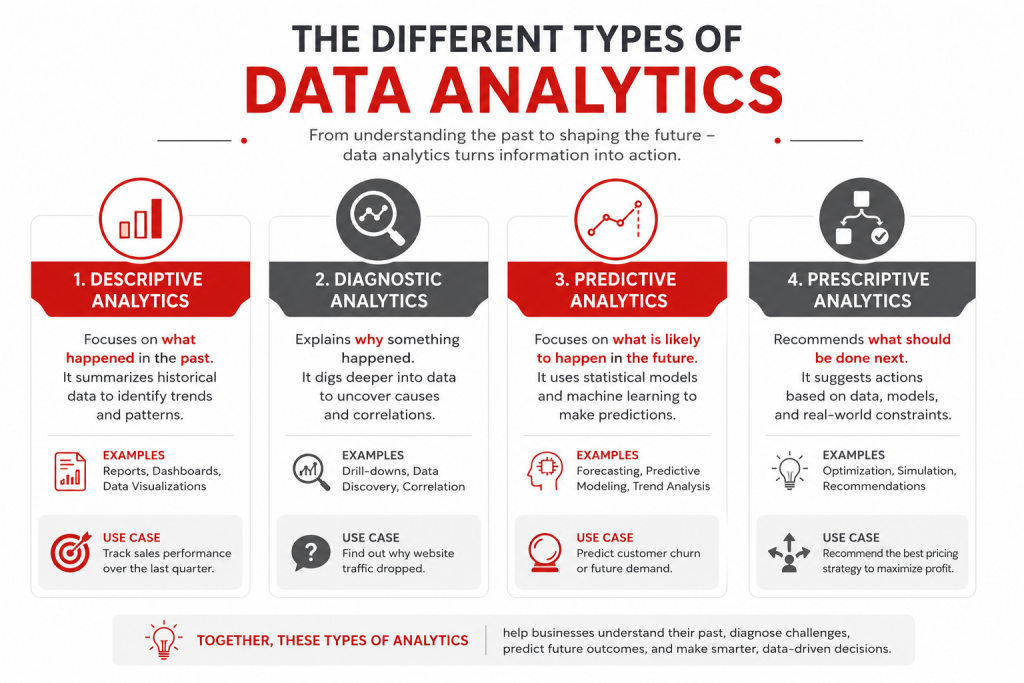
There are 4 accepted types of data analytics. They are as follows:
- Descriptive data analytics: What happened?
In descriptive analytics, large amounts of past data are studied to understand what happened. Using this type of data, you can understand trends, make complex comparisons, and conduct further analysis on the basis of this analysis.
- Diagnostic data analytics: Why did it happen?
Using this type of analysis, we try to understand what caused something to happen. We study the data points and the anomalies and try to understand the cause of certain events. Diagnostic analytics helps to uncover the reasons behind certain events.
- Predictive data analytics: What is likely to happen?
This type of analytics takes past data into account along with models and then tries to predict what is likely to happen in the future.
- Prescriptive data analytics: What should we do?
This type of data analytics helps to answer the question: what should we do? It’s a great way for organizations to determine the best course of action.
What are some best practices for data analytics?
Following the right data analytics practices helps businesses generate accurate insights, improve decision-making, and maximize the value of their data. Here are some key best practices to keep in mind:
1. Begin with Concrete Goals
Before collecting or analyzing data, define what you want to achieve. Whether your goal is to improve customer satisfaction, increase sales, or optimize operations, having a clear objective keeps your analysis on track!
2. Data Quality Comes First!
Focus on the quality and accuracy of your data. Ensure your data is up to date. Check for duplicate entries, errors, and missing data before you begin the analysis.
3. Gather Necessary Data
Gather only the data that supports your business objectives. Excessive or irrelevant data can make analysis more complex and may lead to misleading conclusions. Choose relevant data that supports your analysis.
4. Maintain the Security and Privacy of Data
When businesses deal with sensitive information, data governance is of utmost importance. Ensure strict security measures and control data access. Comply with applicable data privacy regulations to protect your organization’s information.
5. Pick the Appropriate Data Analytics Tools
Select analytics platforms and technologies that match your business requirements, data volume, and technical capabilities. The right tools make it easier to process and visualize data.
6. Make Use of Data Visualization Tools
Present your findings through dashboards, charts, and graphs. Effective visualizations help stakeholders quickly understand trends, identify patterns, and make the right decisions.
7. Update Data Regularly
Data changes over time, so analytics shouldn’t be a one-time exercise. Regularly update your datasets and monitor key metrics. This will help to identify new opportunities, detect anomalies, and respond to changing business conditions.
8. Verify Results Before Using
Always verify your findings by comparing multiple data sources or testing the conclusions. Validating results helps reduce errors. This builds confidence in the decisions or changes that need to be made.
9. Encourage Collaboration With Other Teams
Data analytics delivers the best results when business leaders, analysts, and technical teams work together. Combining technical expertise with business knowledge leads to more accurate interpretations and actionable insights.
10. Highlight Workable Solutions
The ultimate goal of data analytics is to drive better business outcomes. Use the insights you uncover to optimize processes, improve customer experiences, reduce costs, and support vital decision-making.
By following these best practices, organizations can transform raw data into meaningful insights that drive innovation, improve efficiency, and support long-term business growth.
What are the important data analytics process steps?
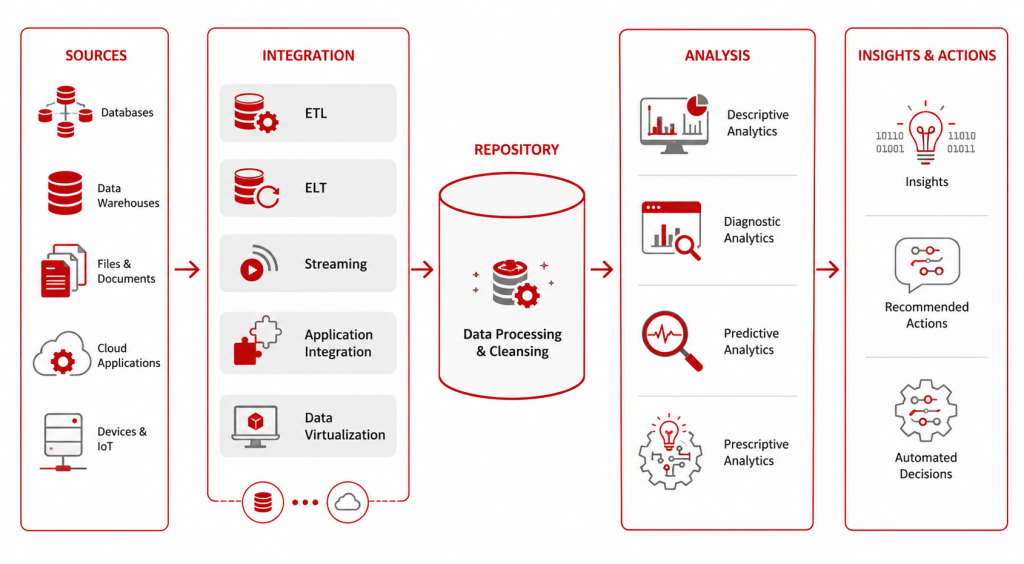
Some of the important data analytics processes and steps are as follows:
- Firstly, define the business objectives for which you propose to conduct data analysis.
- Identify the sources of data from which you will need to gather raw data. For example, social media, CRM applications, ERP applications, etc.
- Integrate all data into a warehouse or lake that is located on the cloud. Data in the lake or warehouse is integrated into one place, giving a single source of information of all your organizational data.
- Perform data analysis on the large sets of cleaned data. Find patterns, trends, and insights.
- Integrate the analytics software into other systems, if needed.
Source: https://www.qlik.com/us/data-analytics
Data Analytics Techniques
Data analytics uses different techniques to collect, organize, analyze, and interpret data. Each technique serves a unique purpose, helping businesses uncover trends, solve problems, and make informed decisions. Here are some of the most common data analytics techniques:
1. Regression Analysis
Regression analysis examines the relationship between variables to predict future outcomes. It is widely used for sales forecasting, demand prediction, customer behavior analysis, and risk assessment.
Example: Predicting next quarter’s sales based on historical revenue and seasonal trends.
2. Classification Analysis
Classification groups data into predefined categories using machine learning algorithms. It helps businesses identify patterns and make decisions based on labeled data.
Example: Classifying emails as spam or non-spam or identifying customers likely to churn.
3. Clustering Analysis
Clustering organizes similar data points into groups without predefined labels. This technique helps discover hidden patterns and customer segments.
Example: Grouping customers based on purchasing behavior for personalized marketing campaigns.
4. Time Series Analysis
Time series analysis studies data collected over time to identify trends, seasonality, and patterns. It is commonly used for forecasting.
Example: Predicting monthly website traffic or stock market movements.
5. Factor Analysis
Factor analysis identifies underlying factors that influence multiple variables. It simplifies complex datasets by reducing the number of variables.
Example: Understanding which factors most influence customer satisfaction.
6. Cohort Analysis
Cohort analysis divides users into groups based on shared characteristics or behaviors over a specific period. It helps measure customer retention and engagement.
Example: Comparing the purchasing behavior of customers who joined during different months.
7. Sentiment Analysis
Sentiment analysis uses natural language processing (NLP) to determine whether text expresses positive, negative, or neutral emotions.
Example: Analyzing customer reviews or social media comments to measure brand perception.
8. Association Rule Analysis
This technique identifies relationships between items that frequently occur together. It is commonly used in retail and e-commerce.
Example: Discovering that customers who buy mattresses often purchase pillows as well.
9. Anomaly Detection
Anomaly detection identifies unusual patterns or outliers that differ significantly from normal behavior. It is widely used in fraud detection and cybersecurity.
Example: Detecting suspicious banking transactions or unauthorized system access.
10. Decision Tree Analysis
Decision trees visually map possible decisions and outcomes based on different conditions. They are easy to interpret and useful for predictive modeling.
Example: Determining whether a customer is likely to respond to a marketing campaign.
11. Text Analytics
Text analytics extracts valuable insights from unstructured text data such as emails, surveys, support tickets, and documents.
Example: Identifying frequently mentioned customer complaints from support conversations.
12. Data Mining
Data mining combines statistical methods, machine learning, and database techniques to uncover hidden patterns and relationships in large datasets.
Example: Identifying purchasing trends that can improve product recommendations.
What are Some Common Data Analytics Tools
Data analytics tools help to get the work done faster, and you need to choose the right tools for your work. Here is a brief list of data analytics tools that you can use.
| Data Analytics Task | Recommended Tools |
| Data Collection | SQL, Google Forms, APIs, Apache Kafka |
| Data Cleaning & Preparation | Excel, Python (Pandas), Alteryx, KNIME |
| Database Querying | SQL, BigQuery, Snowflake |
| Statistical Analysis | R, SAS, SPSS, Python |
| Data Visualization | Tableau, Power BI, Looker Studio, Excel |
| Business Intelligence (BI) | Power BI, Tableau, Looker Studio |
| Predictive Analytics | Python (Scikit-learn), R, SAS |
| Machine Learning | Python (TensorFlow, Scikit-learn), Spark MLlib |
| Big Data Processing | Apache Spark, Hadoop |
| Real-Time Analytics | Apache Kafka, Spark Streaming |
| Dashboard Creation | Tableau, Power BI, Looker Studio |
| Reporting | Excel, Power BI, Tableau |
Data Analytics Use Cases
- Data analytics services for e-commerce:
Retail shops can study the purchase records of their customers, and they can send newsletters, offers, and discounts via email. This creates a customized brand experience, and they can get wallet share.
- Healthcare data analytics services
Data analytics can be used to predict diseases. By looking at a patient’s data, it can build patterns and predict which diseases they are likely to have.
- Financial data analytics services
Banks can assess a customer’s creditworthiness by analyzing various types of financial data, such as spending patterns, income stability, repayment behavior, and payment history.
- Real-time data analytics services
Fraud detection is an example of real-time data analytics.
What is the future of data analytics?
The future of data analytics is being shaped by artificial intelligence (AI), automation, cloud computing, and real-time data processing. As organizations generate larger volumes of data than ever before, analytics is also evolving. It has grown from simply explaining past events to predicting future outcomes as well as recommending the best course of action. Businesses that embrace modern data analytics will certainly gain a competitive edge. This is possible through faster, smarter, and more accurate decision-making.
Read More: Future of Data Analytics: Global Trends and Insights
Frequently Asked Questions
- What is the difference between data science and data analytics?
Data science focuses on collecting, organizing, cleaning, and preparing raw data so it can be used effectively. It combines data engineering, statistics, and machine learning to create reliable datasets and predictive models. Data analytics, on the other hand, is all about examining that prepared data to uncover patterns, answer business questions, and support informed decision-making. Simply put, data science lays the groundwork, while data analytics turns that groundwork into actionable insights. Without accurate, well-prepared data, even the most advanced analysis can produce unreliable results.
- What is data analysis vs data analytics?
Data analysis is the process of studying data to find patterns, trends, and answers to specific questions. Data analytics is a broader process that includes collecting, cleaning, analyzing, and interpreting data to help businesses make better decisions.
- What are qualitative vs quantitative data analysis?
Qualitative and quantitative data analysis are two different approaches to understanding data, each serving a unique purpose. Qualitative data analysis focuses on non-numerical information such as customer feedback, interviews, surveys, emails, and social media comments. Its goal is to identify patterns, opinions, emotions, and behaviors to understand the “why” behind people’s actions. Quantitative data analysis, on the other hand, deals with numerical data such as sales figures, website traffic, conversion rates, and customer demographics. It uses statistical methods to measure trends, compare performance, and answer questions like “how many,” “how often,” or “how much.”
- What kinds of companies does Techno Exponent serve?
Techno Exponent offers data analytics for small businesses and data analytics services for startups and companies that want to outsource their data analytics requirements.
- Which is the best data analytics company for outsourcing?
Techno Exponent is the best data analytics company in India for outsourcing data analytics projects.
